Rapid Data Viz
Andrew Montalenti, CTO

What do we do?
Parse.ly customers

Is online media special?
Websites have a variety of interesting “first-party” metrics:
- pageviews
- unique visitors
- sessions and paths
- time spent
- page engagement (scroll, copy/paste)
- referrers
- search keywords
Third-party metrics emerging
- Comments: Disqus, LiveFyre, Wordpress
- Shares: Twitter, Google+, LinkedIn, Facebook
- Pins and Saves: Pinterest, Delicious
- Upvotes and Likes: Reddit, Digg
- Queues: Instapaper, Readability
What about online journalism?
- Short Shelf Life: average content shelf-life <48 hours
- High Frequency Publishing: 1000’s posts per day
- Unclear Conversion Goals: nothing to buy
Summary breakdowns
Benchmark statistics
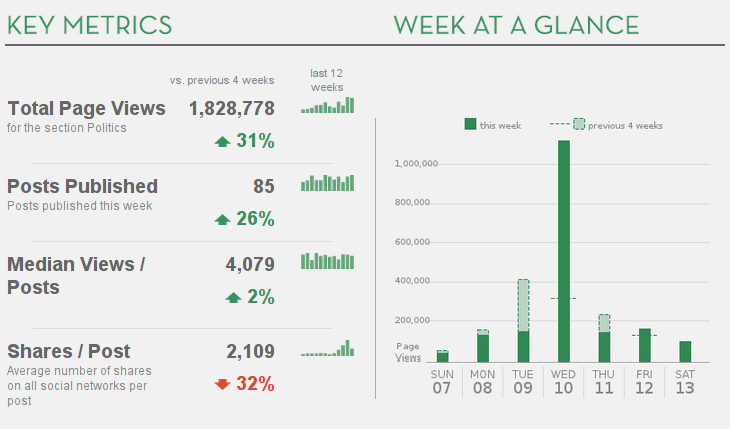
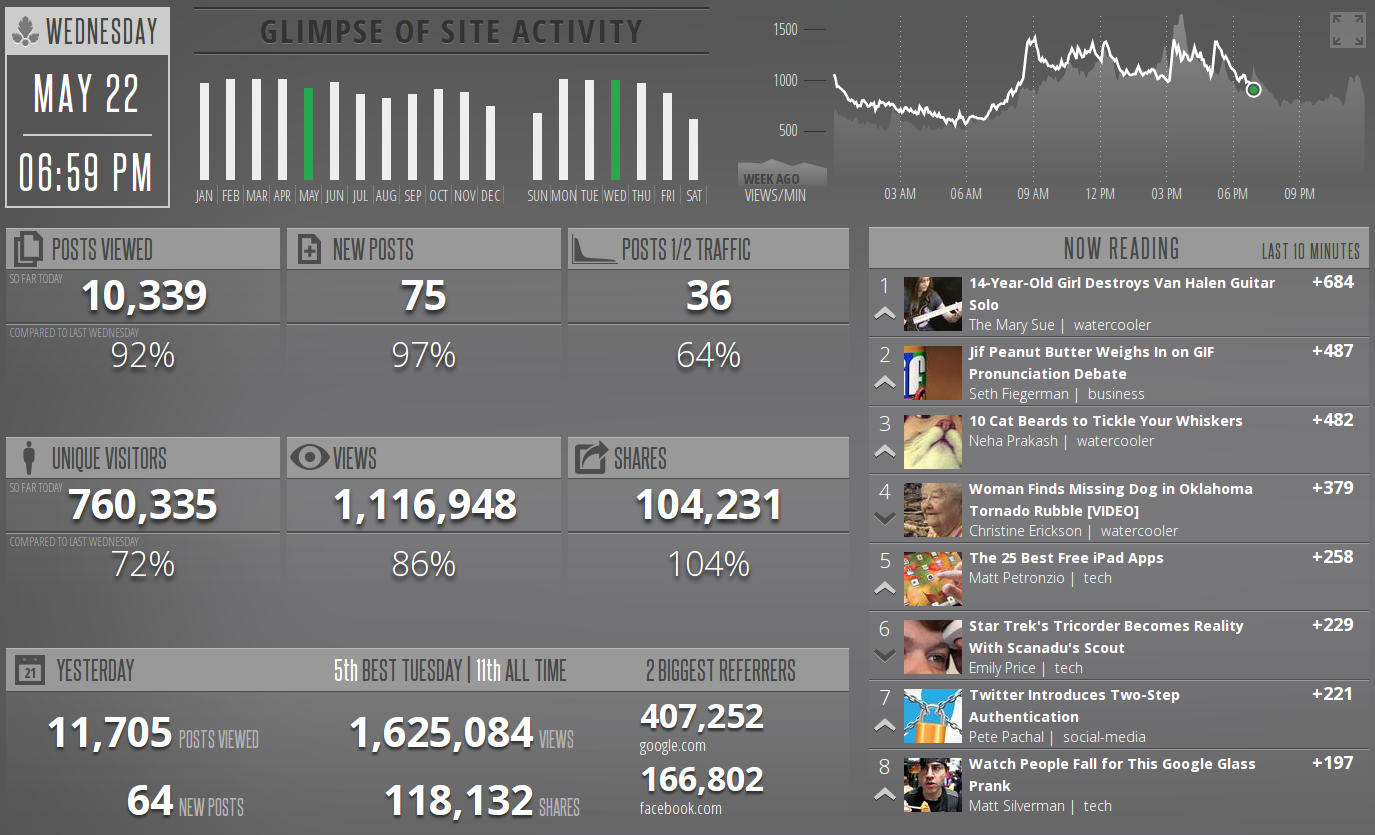
Information radiators
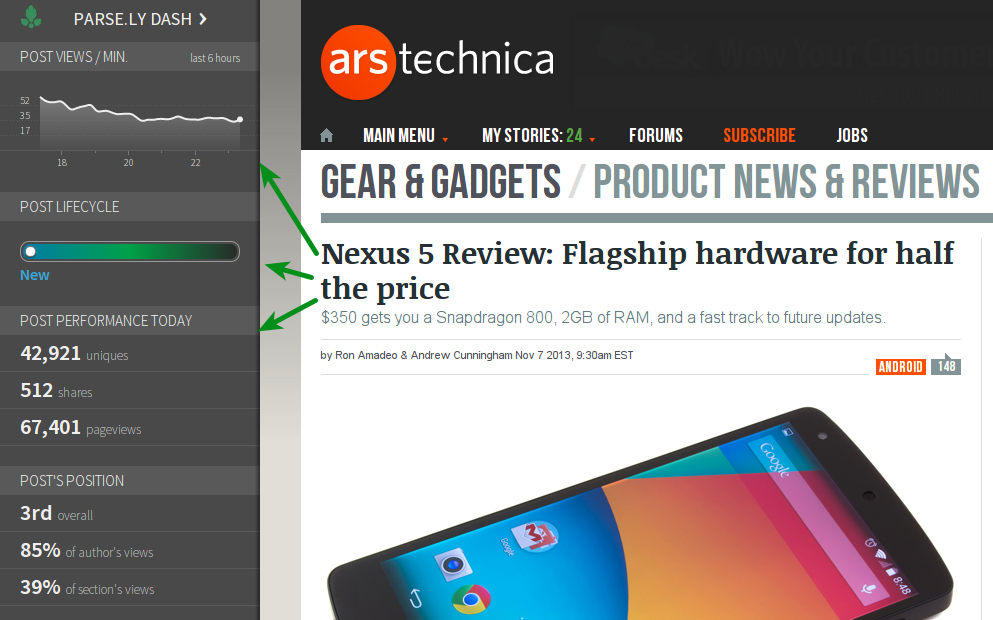
Contextual overlays
How do we do it?
Parse.ly careers

Agenda
- Data Visualization Theory
- webrepl: d3 for browser dataviz
- pyrepl: Pandas for data mining
- vizrepl: IPython Notebook 2.0-dev
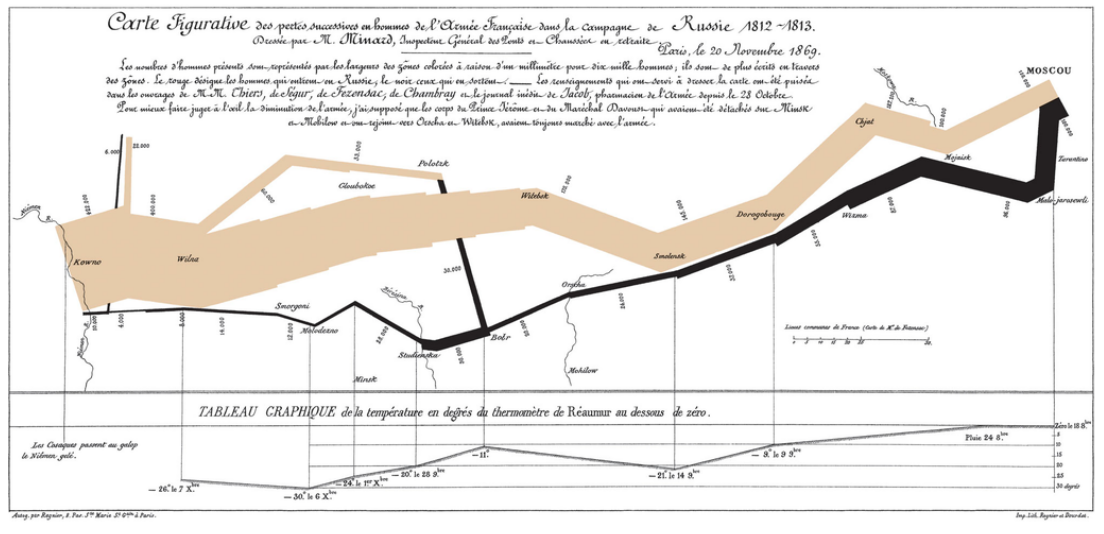
Edward Tufte
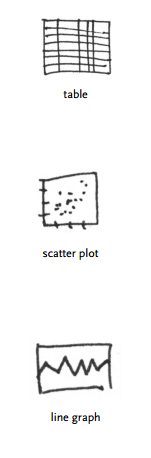
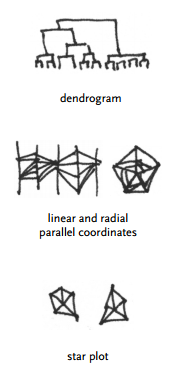
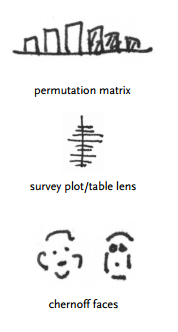
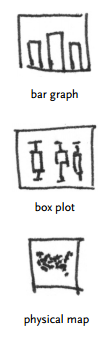
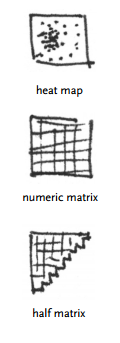
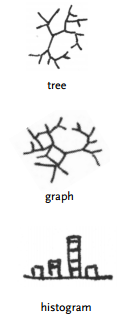
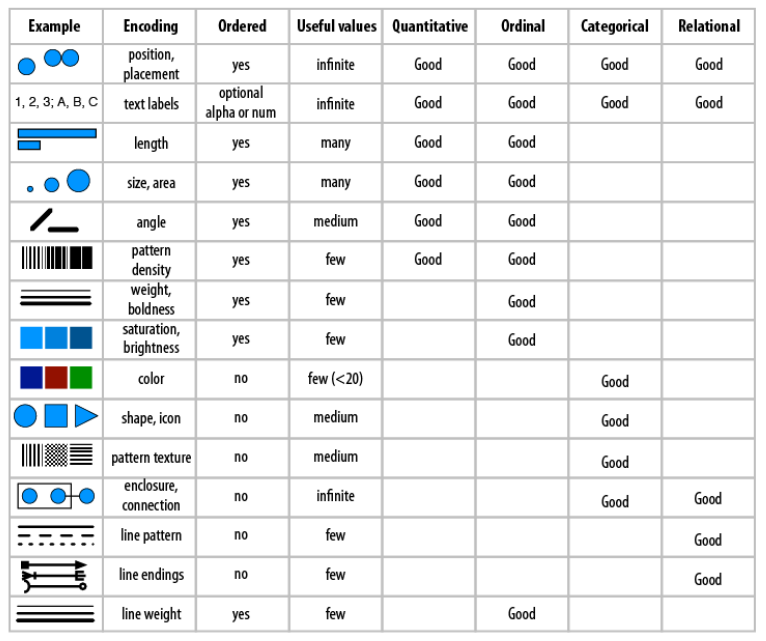
Encoding Guide (1)
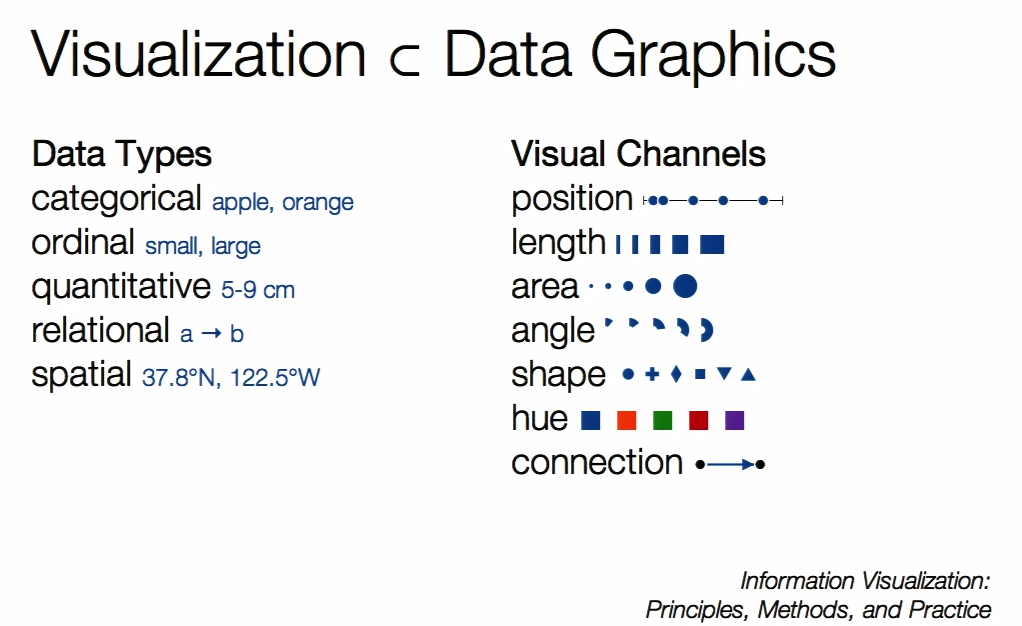
Encoding Guide (2)
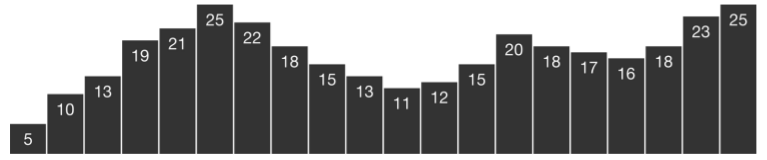
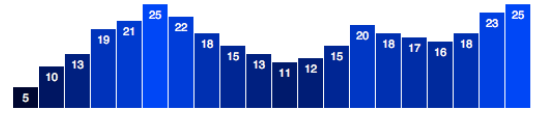
Dense Displays
How to iterate?
Tools for everything, but no dataviz REPL.
Or is there? Enter IPython Notebook, Pandas, the web.
pandas
- dataframes
- loading
- aggregates
- grouping
- sorting
- serializing
- matplotlib
- but, dataviz isn’t “product ready”!
Data my browser!
CONUNDRUM: Once I have some nice, clean, time series (or other) data rendering nicely in the IPython Notebook, how do I get it rendering nicely in the browser?
Options
- d3 bespoke viz: hardest, most flexible
- nvd3 chart models: slightly easier, still very flexible
- vincent/vega: easiest, relatively inflexible
- (these aren’t only options, but IMO best ones)
d3-oriented Approach
- iterate with Pandas and matplotlib
- convert dataframe to JSON
- load JSON with d3
- use d3 for final cleaning
- build scales / axes / labels from scratch
- build interaction layer from scratch
- for offline, use PhantomJS render
d3
- selections
- svg
- scales
- axes
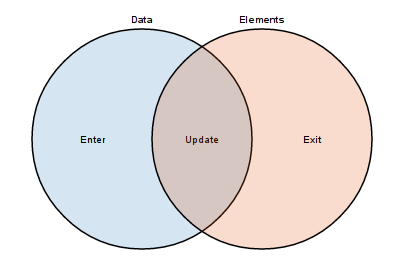
- joins
Data
Documents
Data-Driven Documents
d3 scales
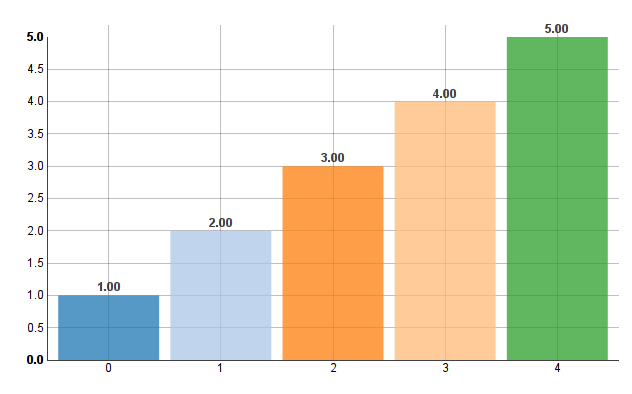
var data = [1, 2, 3, 4, 5];

var width = 200;
var height = 200;

var x = d3.scale
            .ordinal()
            .domain(data)
            .rangeBands([0, width]);
var y = d3.scale
            .linear()
            .domain([0, d3.max(data)])
            .range([0, height]);
var pct = d3.scale
            .linear()
            .domain([0, d3.max(data)])
            .range([0.4, 1]);
d3 scaling
y(1.7) // -> 68px
pct(1.7) // -> 60.4%
y(4.5) // -> 180px
pct(4.5) // -> 94%
x(5) // -> 160px
x.rangeBand() // -> 40px
d3 drawing
var chart = d3.select("#container")
  .append("svg")
    .attr("class", "chart")
    .attr("fill", "steelblue")
    .attr("width", width)
    .attr("height", height)
  .append("svg:g");

chart.selectAll("rect")
    .data(data)
    .enter()
        .append("svg:rect")
            .attr("x", x)
            .attr("height", y)
            .attr("opacity", pct)
            .attr("y", function(d, i) { return height - y(d); })
            .attr("width", x.rangeBand());
Prototyping with d3
I built a tool called “webrepl” for this.
- HTML page with codemirror + emmet
- shortcut that installs jquery, bootstrap, d3 on page
- renders JavaScript code into preview iframe
- Browser inspector lets me look into that frame
What about my data?
Need to convert Pandas DataFrame to JSON format of some sort.
Typically: data and labels.
Typically also a pain in the butt!
nvd3 add-on
- use canned nvd3 chart type
- customize interaction layer atop
nvd3 concepts
- models
- charts
- tooltips
- utilities
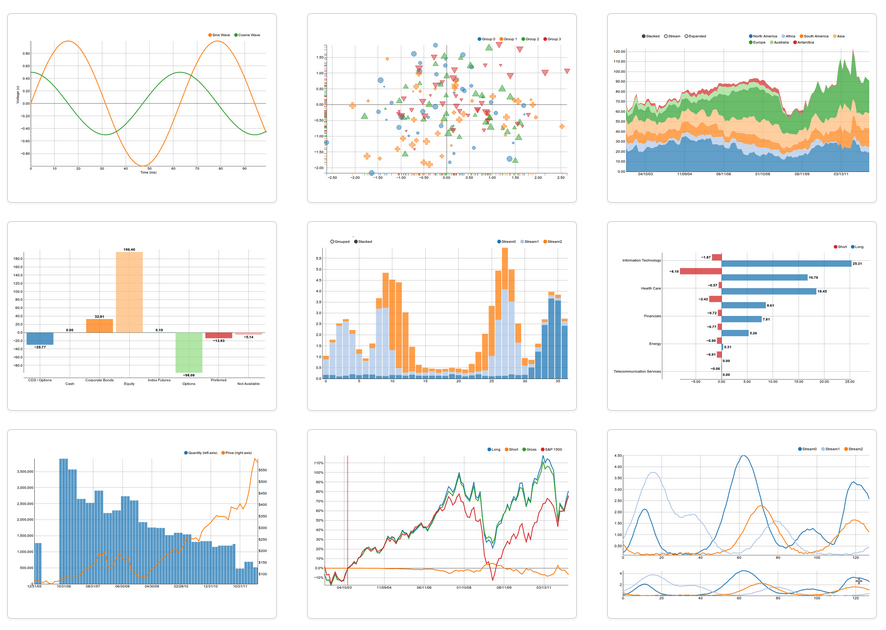
nvd3 graphs
nvd3 approach
Assumes a certain data format, typically an array of dictionaries (series)
var data = [
    {"key": "data",
     "values": [
        1, 2, 3, 4, 5
     ]
    }
];
The values array will become your chart series data – can use your own structure there.
Model is basically a pre-set of d3 scales, axes, labels, and data joins.
nvd3 model
nv.addGraph(function() {
    // build nvd3 chart model
    var chart = nv.models.discreteBarChart()
        .x(function(d, i) { return i })
        .y(function(d) { return d })
            .tooltips(true).showValues(true);

    // plain d3 code to do data-document binding
    d3.select('#chart svg').datum(data)
        .transition().duration(500)
            .call(chart);

    // nv utility for refreshing graph based on window size
    nv.utils.windowResize(chart.update);

    return chart;
});
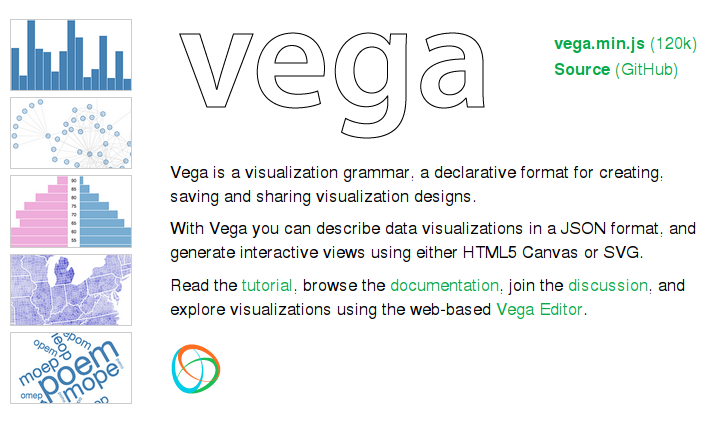
What is Vega?
- Vega is a declarative abstraction for dataviz.
- Essentially, a domain-specific language written in JSON.
- Outputs to d3 and also HTML5 Canvas.
Vega bar example (1)
var spec = {
    "width": 200,
    "height": 200,
    "data": [
        {
            "name": "table",
            "values": [
                {"x":"A", "y":1}, {"x":"B", "y":2}, {"x":"C", "y":3},
                {"x":"D", "y":4}, {"x":"E", "y":5}
            ]
        }
    ],
    // ...
Vega bar example (2)
"scales": [
    {"name": "x",
     "type": "ordinal",
     "range": "width",
     "domain": {"data":"table", "field":"data.x"} },
    {"name": "y",
     "range": "height",
     "nice": true,
     "domain": {"data": "table", "field": "data.y"} },
    {"name": "pct",
     "range": [0.4, 1],
     "nice": true,
     "domain": {"data": "table", "field": "data.y"} }
],
// ...
Vega bar example (3)
"marks": [
    {
        "type": "rect",
        "from": {"data": "table"},
        "properties": {
            "enter": {
                "x": {"scale": "x", "field": "data.x"},
                "width": {"scale":"x", "band": true, "offset": -1},
                "y": {"scale": "y", "field": "data.y"},
                "y2": {"scale": "y", "value": 0},
                "opacity": {"scale": "pct", "field": "data.y"}
            },
            "update": {
                "fill": {"value": "steelblue"}
            }
        }
    }
]
How does Vega work?
- vega runtime generates d3 instructions
- for offline mode, use vg2png/vg2svg
What is Vincent?
- vincent is a Python library that “humanizes” vega.
- use vincent inside IPyNB
- export vega JSON from vincent objects
- run vega JS library to parse JSON
Vincent Graphs

vincent
- vega (JSON)
- declarative visualizations
- HTML canvas
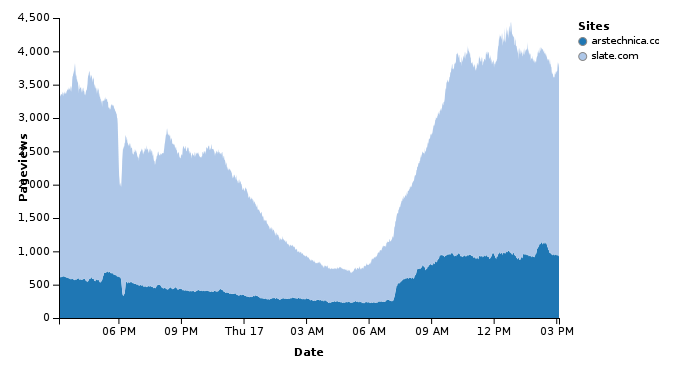
vincent example
site_stack = vincent.StackedArea(df)
site_stack.axis_titles(x='Date', y='Pageviews')
site_stack.legend(title='Sites')
site_stack.display()
My Tools
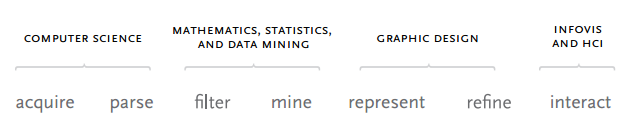
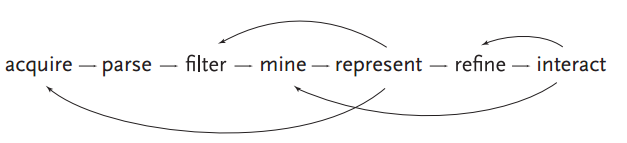
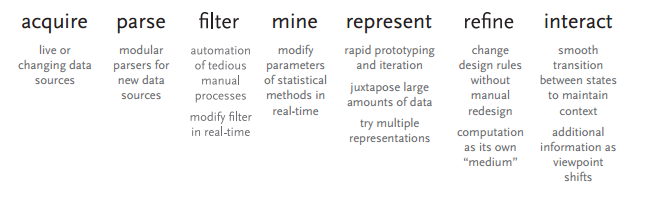
Step Tools acquire pymongo, solr, apache pig parse python stdlib, custom tools filter ipython notebook, listcomps mine pandas represent matplotlib, vincent, nvd3 refine d3, chrome inspector interact d3
Offline: I use Phantom to run full stack, including d3.
Why is IPyNB so exciting?
- execution
- display
- saving / sharing
- platform unification
New IPyNB dataviz utilities
- IPython cell magics (%%html, %%javascript)
- display framework
- ipython locate profile for custom CSS/JS
Future Nirvana
- edit data with Pandas in IPyNB
- snapshot data as JSON cell
- edit d3 / nvd3 code in %%javascript cell
- use IPython.display to show d3 rendering result
- vincent example leads the way here
My Use Cases
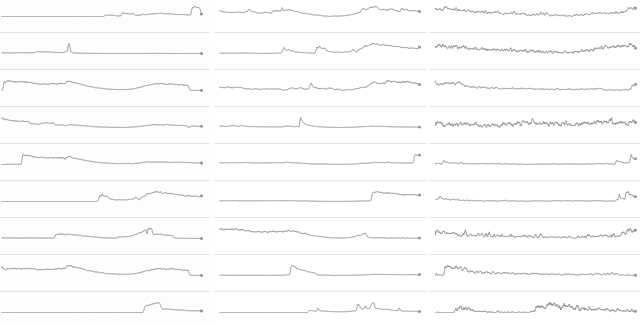
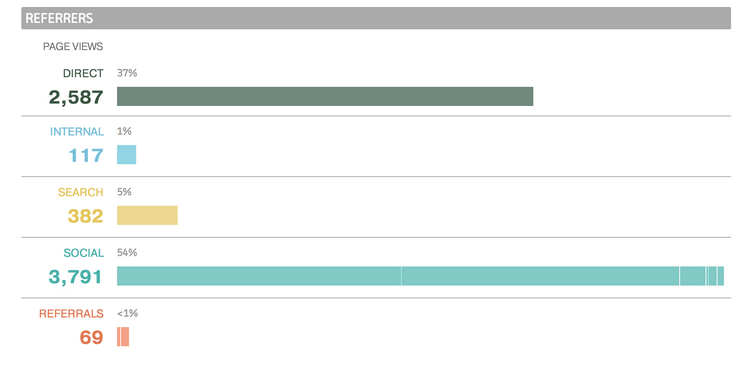
- mine network referrers for trends
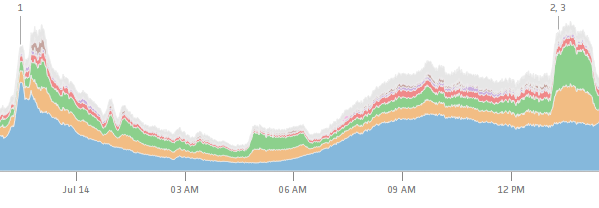
- compare real-time traffic between publishers
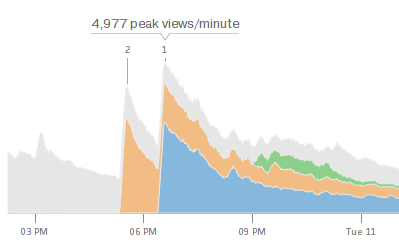
Authority Report

Extra Time?
Talk about new IPyNB comm capabilities.
- Widget framework?
- Python-to-JavaScript bridge via IPython.kernel.comm?
- IPython JavaScript API for cell reading?